
- 在wpf项目中添加userControl:
xmal语句内容:
<Grid>
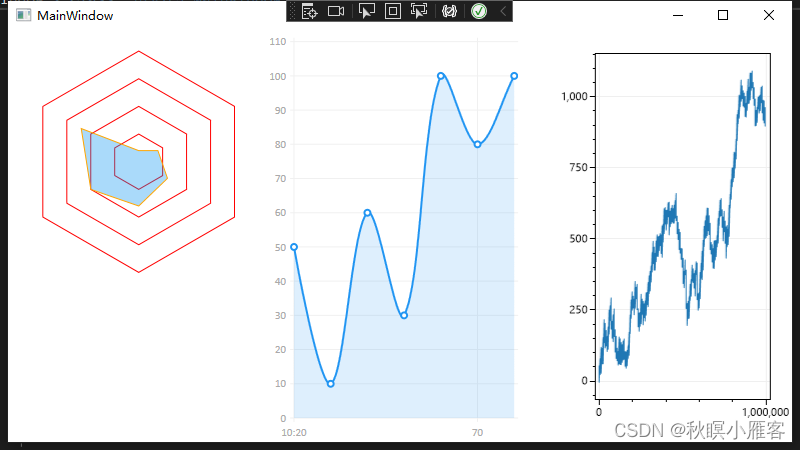
<Polygon Name="polygon1" Stroke="Red" StrokeThickness="1"/>
<Polygon Name="polygon2" Stroke="red" StrokeThickness="1"/>
<Polygon Name="polygon3" Stroke="red" StrokeThickness="1"/>
<Polygon Name="polygon4" Stroke="Red" StrokeThickness="1"/>
<Polygon Name="polygon5" Fill="#550091F0" Stroke="Orange"/>
</Grid>
cs代码内容:
 public partial class UserControl1 : UserControl
    {
        //定义雷达的五个数据
        List<double> values = new List<double>() { 10, 20, 30, 40, 50, 60 };
        public UserControl1()
        {
            InitializeComponent();
            this.Refresh();
            this.SizeChanged += RaderChart_SizeChanged;
        }
        private void RaderChart_SizeChanged(object sender, SizeChangedEventArgs e)
        {
            this.Refresh();
            //throw new NotImplementedException();
        }

        private void Refresh()
        {
            int count = values.Count;
            if (count == 0) return;
            //首先清除一下polygon里存储的数据
            polygon1.Points.Clear();
            polygon2.Points.Clear();
            polygon3.Points.Clear();
            polygon4.Points.Clear();
            polygon5.Points.Clear();
            //去边框长于髋其中最小的值
            double size = Math.Min(RenderSize.Width, RenderSize.Height);

            double radius = size / 2; //得到半径
            double angle = 360 / count;

            for (int i = 0; i < count; i++)
            {
                polygon1.Points.Add(new Point(
                    radius + (radius - 20) * Math.Cos((angle * i - 90) * Math.PI / 180),
                   radius + (radius - 20) * Math.Sin((angle * i - 90) * Math.PI / 180)));
                polygon2.Points.Add(new Point(
                    radius + (radius - 20) * 0.25 * Math.Cos((angle * i - 90) * Math.PI / 180),
                   radius + (radius - 20) * 0.25 * Math.Sin((angle * i - 90) * Math.PI / 180)));
                polygon3.Points.Add(new Point(
                    radius + (radius - 20) * 0.5 * Math.Cos((angle * i - 90) * Math.PI / 180),
                   radius + (radius - 20) * 0.5 * Math.Sin((angle * i - 90) * Math.PI / 180)));
                polygon4.Points.Add(new Point(
                    radius + (radius - 20) * 0.75 * Math.Cos((angle * i - 90) * Math.PI / 180),
                   radius + (radius - 20) * 0.75 * Math.Sin((angle * i - 90) * Math.PI / 180)));
                polygon5.Points.Add(new Point(
                    radius + (radius - 20) * (values[i] * 1.0 / 100) * Math.Cos((angle * i - 90) * Math.PI / 180),
                    radius + (radius - 20) * (values[i] * 1.0 / 100) * Math.Sin((angle * i - 90) * Math.PI / 180)));

            }
        }
    }
}
- 添加liveChart
注:liveChart具有较好的可视化效果,但是使用cpu计算数据量大的时候会发生卡顿(>2000)
 <!--图标对象-->
        <!--一个图表对象下包括多个序列,一个序列下包含多个数据-->
        <!--LiveChart数据量有限-->

            <lvc:CartesianChart Grid.Column="1">
            <lvc:CartesianChart.Series>
                <lvc:LineSeries Values="50,10,60,30,100,80,100"/>

                </lvc:CartesianChart.Series>
            <lvc:CartesianChart.AxisX>
                <lvc:Axis Labels=" 10:20,20:10,30:20,40:50,50:40,70"/>
            </lvc:CartesianChart.AxisX>

        </lvc:CartesianChart>
- 添加scottPlot
适合大数据的显示
 private void LoadPlot()
        {
            Random random = new Random();
            int pointCnt = (int)1e6;//一百万个数据
            this.wpfPlot.plt.PlotSignal(DataGen.RandomWalk(random, pointCnt));
            this.wpfPlot.Refresh();
        }
版权声明:本文内容由互联网用户自发贡献,该文观点与技术仅代表作者本人。本站仅提供信息存储空间服务,不拥有所有权,不承担相关法律责任。如发现本站有涉嫌侵权/违法违规的内容, 请发送邮件至 dio@foxmail.com 举报,一经查实,本站将立刻删除。