

OpenHarmony最近一段时间,简直火的一塌糊度,学习OpenHarmony相关的技术栈也有一段时间了,做个记账本小应用,将所学知识点融合记录一下。
1、记账本涉及知识点
- 基础组件(Button、Select、Text、Span、Divider、Image)、容器(Row、Flex、List、Grid、Column)、定位(position)、路由(router)、Toast(promptAction)、Web组件;
- 自定义弹窗(@CustomDialog);
- 分布式键值数据库(@ohos.data.distributedKVStore);
- Web组件;
- OpenHarmony三方库;
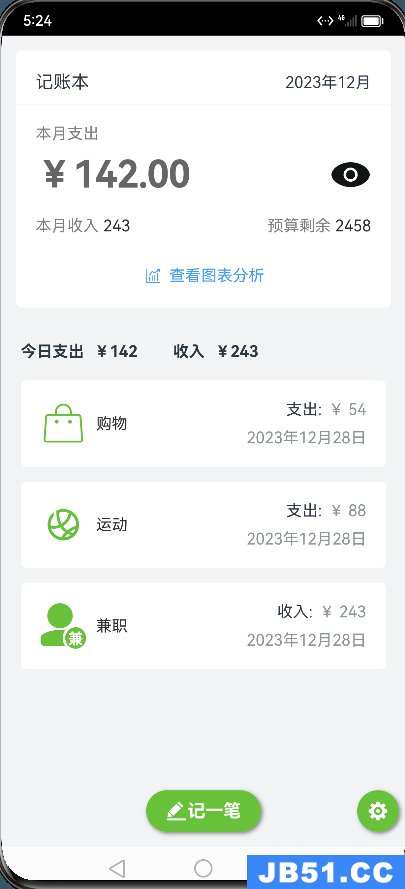
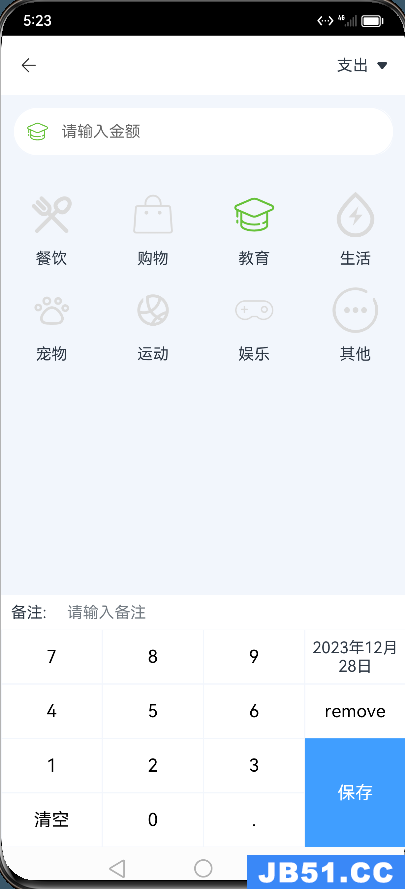
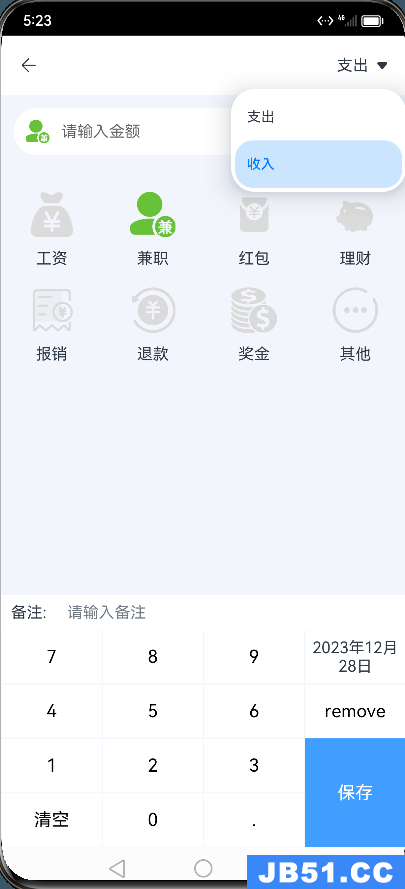
2、效果预览
3、功能点实现简介
3.1 自定义弹窗
// 自定义弹窗定义
@CustomDialog
struct CustomDialogSetting {
  // 双向绑定传值
  @Link settingBudgetValue: string
  // 弹窗控制器,控制打开/关闭,必须传入,且名称必须为:controller
  controller: CustomDialogController
  // 弹窗中的按钮事件
  cancel: () => void
  confirm: () => void

  // 弹窗中的内容描述
  build() {
    Column() {
      Text($r('app.string.budget_setting'))
        .fontSize(18)
        .fontWeight(FontWeight.Bold)
        .margin(12)
        .textAlign(TextAlign.Center)
        .width("100%")
      TextInput({
        placeholder: $r('app.string.estimated_amount_tips'),text: this.settingBudgetValue
      })
        .type(InputType.Number)
        .height(60)
        .width('90%')
        .onChange((value: string) => {
          this.settingBudgetValue = value
        })
      Flex({ justifyContent: FlexAlign.SpaceAround }) {
        Button($r('app.string.cancel'))
          .onClick(() => {
            this.settingBudgetValue = ''
            this.controller.close()
            this.cancel()
          }).backgroundColor(0xffffff).fontColor(Color.Black)
        Button($r('app.string.confirm'))
          .onClick(() => {
            this.controller.close()
            this.confirm()
          }).backgroundColor(0xffffff).fontColor(AccountBookConstant.FONT_COLOR_BLUE)
      }.margin(15)
    }
  }
}
// 使用自定义弹窗
dialogController: CustomDialogController = new CustomDialogController({
builder: CustomDialogSetting({
cancel: this.onCancel.bind(this),confirm: this.onAccept.bind(this),settingBudgetValue: $settingBudgetValue
}),cancel: this.onCancel,autoCancel: true,alignment: DialogAlignment.Center,gridCount: 4,customStyle: false
})
// 开启弹窗
this.dialogController.open()3.2 悬浮按钮
// 设置按钮, 通过position进行绝对定位
Button({  stateEffect: true }){
  Image($rawfile('setting.svg')).width(22).height(22)
}.width(42).height(42)
.borderRadius(90)
.shadow({ radius: 10,color: Color.Gray,offsetX: 5,offsetY:5 })
.position({ x: '98%',y: '98%' })
.markAnchor({ x: '98%',y: '98%'})
.margin(10).backgroundColor('#67C23A')
.onClick(() => {
  if (this.dialogController != undefined) {
    this.dialogController.open()
  }
})
3.3 数据存储
// 定义键值对存储类

import distributedKVStore from '@ohos.data.distributedKVStore';

const BUNDLE_NAME = "baseInfo"

let context = getContext(this)
// 数据库对象
let kvManager: distributedKVStore.KVManager | undefined = undefined;
// KVStore数据库
let kvStore: distributedKVStore.SingleKVStore | undefined = undefined;

class DistributedUtil {
  constructor() {
    this.createKeyValueDB();
  }
  async getKvManager(bundleName?: string) {
    const kvStoreConfig: distributedKVStore.KVManagerConfig = {
      context: context,bundleName: bundleName || BUNDLE_NAME
    };
    try {
      kvManager = distributedKVStore.createKVManager(kvStoreConfig);
    }
    catch (err) {
      console.error(`error:${err}`)
    }
  }

  // 创建并得到指定类型的KVStore数据库
  async createKeyValueDB(op?: distributedKVStore.Options) {
    if (!kvManager) {
      await this.getKvManager();
    }
    try {
      const options: distributedKVStore.Options = {
        // 当数据库文件不存在时是否创建数据库,默认为true
        createIfMissing: true,// 设置数据库文件是否加密,默认为false,即不加密
        encrypt: false,// 设置数据库文件是否备份,默认为true,即备份
        backup: false,// 设置数据库文件是否自动同步。默认为false,即手动同步
        autoSync: true,// kvStoreType不填时,默认创建多设备协同数据库
        kvStoreType: distributedKVStore.KVStoreType.SINGLE_VERSION,// 多设备协同数据库:kvStoreType: distributedKVStore.KVStoreType.DEVICE_COLLABORATION,securityLevel: distributedKVStore.SecurityLevel.S1
      };
      kvManager.getKVStore<distributedKVStore.SingleKVStore>('storeId',op || options,(err,store: distributedKVStore.SingleKVStore) => {
        if (err) {
          console.error(`Failed to get KVStore: Code:${err.code},message:${err.message}`);
          return;
        }
        console.info('Succeeded in getting KVStore.');
        kvStore = store;
      });
    } catch (e) {
      console.error(`An unexpected error occurred. Code:${e.code},message:${e.message}`);
    }
    return kvStore;
  }

  // 删除指定键值的数据
  async deleteStoreData(key: string) {
    if (!kvStore) {
      return;
    }

    try {
      kvStore.delete(key,(err) => {
        if (err !== undefined) {
          console.error(`Failed to delete data. Code:${err.code},message:${err.message}`);
          return;
        }
        console.info('Succeeded in deleting data.');
      });
    } catch (e) {
      console.error(`An unexpected error occurred. Code:${e.code},message:${e.message}`);
    }
  }

  // 向键值数据库中插入数据
  async putStoreData(key: string,value: any) {
    if (!key || !value) {
      return
    }

    if(!kvStore) {
      kvStore = await this.createKeyValueDB();
    }

    try {
      kvStore.put(key,value,(err) => {
        if (err !== undefined) {
          console.error(`Failed to put data. Code:${err.code},message:${err.message}`);
          return;
        }
        console.info('Succeeded in putting data.');
      });
    } catch (e) {
      console.error(`putStoreData===>An unexpected error occurred. Code:${e.code},message:${e.message}`);
    }
  }

  // 获取指定键的值
  async getStoreData(key: string) {
    if (!key) {
      return
    }

    if(!kvStore) {
      kvStore = await this.createKeyValueDB();
    }

    return new Promise((resolve,reject) => {
      try {
        kvStore.get(key,data) => {
          if (err != undefined) {
            console.error(`Failed to get data. Code:${err.code},message:${err.message}`);
            reject(err)
            return;
          }
          resolve(data)
        });
      } catch (err) {
        reject(err)
        console.error('TAG-getStoreData',`Failed to get value,Cause: ${err}`)
      }
    });
  }
}

export default new DistributedUtil();
// 使用键值对存储
import distributedUtil from '../../common/distributedStrong'
// 1、增加
distributedUtil.putStoreData('amountRecords',JSON.stringify(dataArray))
// 2、 获取
distributedUtil.getStoreData('amountRecords').then((res: string) => {
if(res) {
const result = JSON.parse(res)
// 处理存储的图片资源,会自动转换为id的形式,无法直接获取展示
result.map(item => {
item.icon = $rawfile(item.icon.params[0])
return item
})
this.recordsArray = result
}
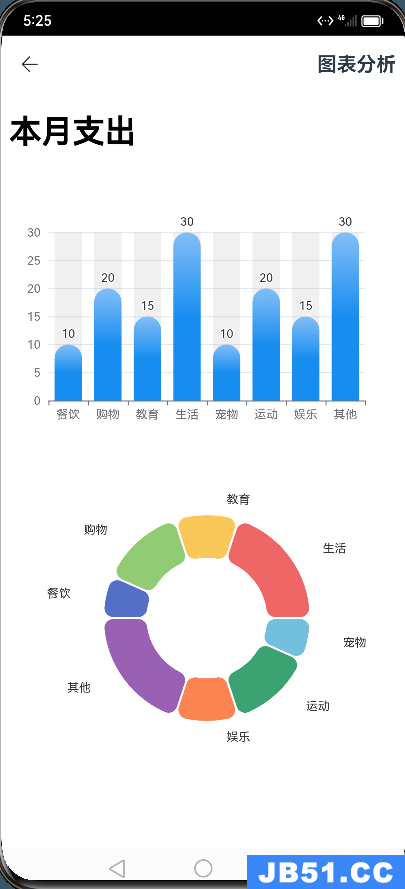
})3.4 统计图表
3.4.1 定义本地html文件
在resources下创建rawfile文件夹,增加chart.html文件
<!DOCTYPE html>
<html>
<head>
    <meta charset="utf-8">
    <title>柱状图示例</title>
    <script src="./js/echarts5.4.0.js"></script>
</head>
<body>
<h1>本月支出</h1>
<div id="chartBarContainer" style="width: 400px; height: 300px;"></div>

<div id="chartPieContainer" style="width: 400px; height: 300px;"></div>

</body>
<script>
    function initBarChart(chartData) {
      const data = JSON.parse(chartData);

      var chartContainer = document.getElementById('chartBarContainer');
      var chart = echarts.init(chartContainer);

      var option = {
        tooltip: {
          trigger: 'axis',axisPointer: {
            type: 'shadow'
          }
        },xAxis: {
          type: 'category',data: data.xAxisData
        },yAxis: {
          type: 'value'
        },series: [{
          data: data.seriesData,type: 'bar',showBackground: true,stack: 'Total',label: {
            show: true,position: 'top'
          },emphasis: {
            itemStyle: {
              color: new echarts.graphic.LinearGradient(0,1,[
                { offset: 0,color: '#2378f7' },{ offset: 0.7,{ offset: 1,color: '#83bff6' }
              ])
            }
          },itemStyle: {
            borderRadius: [25,25,0],color: new echarts.graphic.LinearGradient(0,[
              { offset: 0,color: '#83bff6' },{ offset: 0.5,color: '#188df0' },color: '#188df0' }
            ])
          }
        }]
      };

      chart.setOption(option);
    }

    function initPieChart(chartData) {
      const data = JSON.parse(chartData);

      var chartContainer = document.getElementById('chartPieContainer');
      var chart = echarts.init(chartContainer);

      var option = {
        tooltip: {
          trigger: 'item'
        },legend: {
          show: false,top: '5%',left: 'center'
        },type: 'pie',radius: ['40%','70%'],avoidLabelOverlap: false,itemStyle: {
            borderRadius: 10,borderColor: '#fff',borderWidth: 2
          },startAngle: 180,labelLine: {
            show: true,length: 20,// 标签线的长度
            length2: 50 // 标签线的第二段长度
          },emphasis: {
            label: {
              show: true,fontSize: 40,fontWeight: 'bold'
            }
          },labelLine: {
            show: false
          }
        }]
      };

      chart.setOption(option);
    }
</script>
</html>
3.4.2 Web组件使用本地文件
import web_webview from '@ohos.web.webview'

@Entry
@Component
struct Chart {
    controllerWeb: web_webview.WebviewController = new web_webview.WebviewController()

    build() {
        Web({ src: $rawfile('barChart.html'),controller: this.controllerWeb })
    }
}
3.4.3 Web组件向H5页面传值,调用H5中的方法
// 初始化柱状图
const codeJS = `
  initBarChart('${JSON.stringify(this.chartBarData)}')
`
this.controllerWeb.runJavaScript(codeJS)
3.4.4 完整调用代码
import web_webview from '@ohos.web.webview'
import router from '@ohos.router';

interface ChartDataType {
  xAxisData?: Array<string | number>;
  seriesData?: Array<string | number | any>;
}

@Entry
@Component
struct BarChart {
  controllerWeb: web_webview.WebviewController = new web_webview.WebviewController()
  private chartBarData: ChartDataType = {
    xAxisData: ['餐饮','购物','教育','生活','宠物','运动','娱乐','其他'],seriesData: [10,20,15,30,10,30],}

  private chartPieData: ChartDataType = {
    seriesData: [
      { value: 10,name: '餐饮' },{ value: 20,name: '购物' },{ value: 15,name: '教育' },{ value: 30,name: '生活' },{ value: 10,name: '宠物' },name: '运动' },name: '娱乐' },name: '其他' },],}

  build() {
    Column() {
      Row() {
        Button() {
          Image($rawfile('icon_back.png')).width(18)
        }
        .backgroundColor(Color.Transparent)
        .padding(10)
        .onClick(() => router.back())

        Text('图表分析').fontSize(20).fontWeight(FontWeight.Bold)
      }
      .padding(10)
      .justifyContent(FlexAlign.SpaceBetween)
      .width('100%')
      Web({ src: $rawfile('barChart.html'),controller: this.controllerWeb })
        .verticalScrollBarAccess(true)
        .javaScriptAccess(true)
        .onPageEnd(() => {
          // 初始化柱状图
          const codeJS = `
            initBarChart('${JSON.stringify(this.chartBarData)}')
          `
          this.controllerWeb.runJavaScript(codeJS)

          // 初始化饼图
          const codeJSPie = `
            initPieChart('${JSON.stringify(this.chartPieData)}')
          `
          this.controllerWeb.runJavaScript(codeJSPie)
        })
    }.width('100%').height('100%')
  }
}
3.4.5 传值注意点总结
- 传递数据需要通过 JSON.stringify() 转换为字符串;
- 传递的参数必须使用引号包裹,否则无法调用到H5中的方法;
- H5中使用传过来的数据,同理,需要使用 JSON.parse() 进行转换;
3.5 自定义键盘
使用Grid布局,通过rowStart、rowEnd、columnStart、columnEnd进行单元格合并。或者使用column和row布局,循环即可。
参考:https://gitee.com/harmonyos/codelabs/tree/master/SimpleCalculator
Grid() {
  GridItem() {
    this.GridItemButtonBuilder('7')
  }.gridItemStyle().onClick(() => { this.clickBtn(7) })
  GridItem() {
    this.GridItemButtonBuilder('8')
  }.gridItemStyle().onClick(() => { this.clickBtn(8) })
  GridItem() {
    this.GridItemButtonBuilder('9')
  }.gridItemStyle().onClick(() => { this.clickBtn(9) })
  GridItem() {
    Text(this.time).backgroundColor(Color.White).width('100%').height('100%').textAlign(TextAlign.Center)
  }.gridItemStyle()

  GridItem() {
    this.GridItemButtonBuilder('4')
  }.gridItemStyle().onClick(() => { this.clickBtn(4) })
  GridItem() {
    this.GridItemButtonBuilder('5')
  }.gridItemStyle().onClick(() => { this.clickBtn(5) })
  GridItem() {
    this.GridItemButtonBuilder('6')
  }.gridItemStyle().onClick(() => { this.clickBtn(6) })
  GridItem() {
    this.GridItemButtonBuilder('remove')
  }.gridItemStyle().onClick(() => { this.clickBtn('remove') })

  GridItem() {
    this.GridItemButtonBuilder('1')
  }.gridItemStyle().onClick(() => { this.clickBtn('1') })
  GridItem() {
    this.GridItemButtonBuilder('2')
  }.gridItemStyle().onClick(() => { this.clickBtn('2') })
  GridItem() {
    this.GridItemButtonBuilder('3')
  }.gridItemStyle().onClick(() => { this.clickBtn('3') })
  GridItem() {
    this.GridItemButtonBuilder('保存','#409EFF')
  }.rowStart(2).rowEnd(3).columnStart(3).columnEnd(4).onClick(() => { this.clickBtn('save') })

  GridItem() {
    this.GridItemButtonBuilder('清空')
  }.gridItemStyle().onClick(() => { this.clickBtn('clear') })
  GridItem() {
    this.GridItemButtonBuilder('0')
  }.gridItemStyle().onClick(() => { this.clickBtn('0') })
  GridItem() {
    this.GridItemButtonBuilder('.')
  }.gridItemStyle().onClick(() => { this.clickBtn('.') })
}
.height(220)
.columnsTemplate('1fr 1fr 1fr 1fr')
.rowsTemplate('1fr 1fr 1fr 1fr')
.rowsGap(0)
.margin({ top: 0 })
4、扩展(如何使用基础组件自定义柱状图)
- 使用Stack容器进行堆叠
- 通过Rect绘制柱子
- 通过Divider绘制分割线
一个简单的柱状图就完成了,具体可以参考健康生活,希望ArkUI可以早日集成Echarts类似的图表组件,JS版本的有Chart组件,ArkTs的还未集成,期待官方❤️❤️❤️
@Builder
content(item: OneMealStatisticsInfo) {
  Column() {
    if (item.totalFat > 0) {
      Rect({ width: 14,height: item.totalFat / 200 + 14,radius: 7 }).fill('#FD9A42')
        .padding({ top: 14 })
        .margin({ bottom: -28 })
    }
    if (item.totalProtein > 0) {
      Rect({ width: 14,height: item.totalProtein / 200 + 14,radius: 7 })
        .fill('#FBD44E')
        .padding({ top: 14 })
        .margin({ bottom: -21 })
    }
    if (item.totalCarbohydrates > 0) {
      Rect({ width: 14,height: item.totalCarbohydrates / 200 + 14,radius: 7 }).fill('#73CD57')
        .padding({ top: 7 })
        .margin({ bottom: -7 })
    }
  }.clip(true)
 }

@Builder
legendComponent(item: HistogramLegend) {
  Text(item.value).fontSize(12).fontColor('#18181A').fontFamily('HarmonyHeTi')
}

@Component
struct Histogram {
  @Consume("dietData") dietData: Array<OneMealStatisticsInfo>
  @BuilderParam content?: (item: OneMealStatisticsInfo) => void
  @BuilderParam legendComponent?: (item: HistogramLegend) => void
  private title: string | Resource = ''
  private legend: HistogramLegend[] = []

  build() {
    Column() {
      Text(this.title)
        .textAlign(TextAlign.Start)
        .fontSize(24)
        .fontColor('#000000')
        .fontFamily('HarmonyHeTi-Medium')
        .width('100%')
        .height(46)

      Stack({ alignContent: Alignment.Bottom }) {
        Column() {
          ForEach([0,() => {
            Divider()
              .strokeWidth(1)
              .color('#D8D8D8')
          })
        }
        .height('100%')
        .margin({ top: 20 })
        .justifyContent(FlexAlign.SpaceBetween)

        Column() {
          Flex({ direction: FlexDirection.Row,justifyContent: FlexAlign.SpaceEvenly,alignItems: ItemAlign.Start }) {
            ForEach(this.dietData,(item: OneMealStatisticsInfo) => {
              if (item.mealFoods.length > 1) {
                Column() {
                  if (this.content !== undefined) {
                    this.content(item)
                  }
                  Text(item.mealTime.name).fontSize(14)
                    .fontColor('#7E7E7E')
                    .fontFamily('HarmonyHeTi')
                    .margin({ top: 10 })
                }
                .justifyContent(FlexAlign.End)
                .height('100%')
              }
            })
          }
        }
        .height(236)
      }
      .height(190)

      Row() {
        ForEach(this.legend,(item: HistogramLegend) => {
          Row() {
            Rect({ width: 9,height: 9,radius: 9 }).fill(item.color).margin({ right: 18 })
            if (this.legendComponent !== undefined) {
              this.legendComponent(item)
            }
          }
        })
      }
      .justifyContent(FlexAlign.SpaceEvenly)
      .width('100%')
      .margin({ top: 70 })
    }
    .height('100%')
    .padding({ left: 32,right: 32 })
    .borderRadius(12)
    .backgroundColor('#FFFFFF')
  }
}
后面计划基于canvas基础组件实现一个柱状图,不断学习,期望鸿蒙不断强大完善。
原文地址:https://blog.csdn.net/qq_23334071/article/details/135285135
版权声明:本文内容由互联网用户自发贡献,该文观点与技术仅代表作者本人。本站仅提供信息存储空间服务,不拥有所有权,不承担相关法律责任。如发现本站有涉嫌侵权/违法违规的内容, 请发送邮件至 dio@foxmail.com 举报,一经查实,本站将立刻删除。