
分享一个公司项目案例
UI小姐姐给的图是这样的:
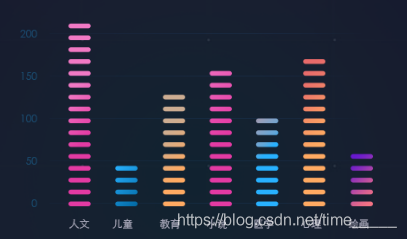
最终实现效果:

以下是所有代码
源码:https://gitee.com/DieHunter/myCode/tree/master/Echart/PictorialBar
首先引入Echarts,cdn或npm都行
HTML:
<!DOCTYPE html>
<html lang="en">

<head>
    <meta charset="UTF-8">
    <meta name="viewport" content="width=device-width,initial-scale=1.0">
    <title>Document</title>
    <style>
        * {
            margin: 0;
            padding: 0;
        }

        .myChartBox {
            margin: 100px auto;
            width: 450px;
            height: 240px;
            background: #000;
        }
    </style>
    <script src="./data.js"></script>
    <script src="./echarts.js"></script>
    <script src="./myChart.js"></script>
</head>

<body>
    <div id="myChartBox" class="myChartBox"></div>
    <script>
        let _myChart,_option,timer = 1.5,timeTickId,colorList,chartConfig; //初始化变量,分别是初始化后的echart对象,echart配置信息,图表刷新频率,延时递归函数id,图表渐变颜色列表了,列表联动配置
        let {
            category,lineData
        } = filterData(bookList) //过滤后端数据,规范成x轴数组和y轴数组格式
        let init = () => {
            _myChart = echarts.init(myChartBox); //初始化chart
            colorList = {
                first: ["#F179C4","#26AEFB","#CDAD92","#ED65BA","#989FBB","#E86A6A","#6718CF"],second: ["#E33AA3","#056FAB","#FFAA62","#E33AA3","#28B1FF","#F47384"]
            }
            chartConfig = { //配置信息为,chart中横坐标第一项索引,最后一项索引,规定列表长度
                first: 0,second: 7,max: 20
            }
            createChart()
        };
        (() => {
            init()
        })()
    </script>
</body>

</html>
data.js(暂存数据)
const bookList = [{
    "typeName": "综合图书","bnum": 28264
},{
    "typeName": "文学","bnum": 14591
},{
    "typeName": "儿童文学","bnum": 10186
},{
    "typeName": "文化教育","bnum": 20477
},{
    "typeName": "语言文字","bnum": 17344
},{
    "typeName": "哲学","bnum": 16238
},{
    "typeName": "历史地理","bnum": 15457
},{
    "typeName": "政治思想","bnum": 5793
},{
    "typeName": "生物科学","bnum": 4966
},{
    "typeName": "绘本","bnum": 4521
},{
    "typeName": "艺术","bnum": 4157
},{
    "typeName": "地球天文","bnum": 2545
},{
    "typeName": "军事","bnum": 2368
},{
    "typeName": "自然科学","bnum": 2358
},{
    "typeName": "工业技术","bnum": 1830
},{
    "typeName": "社会科学","bnum": 1689
},{
    "typeName": "数理化","bnum": 1394
},{
    "typeName": "政治法律","bnum": 1303
},{
    "typeName": "少年百科","bnum": 1201
},{
    "typeName": "经济","bnum": 923
},{
    "typeName": "童话故事","bnum": 840
},{
    "typeName": "环境安全","bnum": 615
},{
    "typeName": "医药卫生","bnum": 518
},{
    "typeName": "航空航天","bnum": 457
},{
    "typeName": "农业科学","bnum": 347
},{
    "typeName": "家庭教育","bnum": 211
},{
    "typeName": "交通运输","bnum": 188
}]
myChart.js
let createChart = () => {
    _option = {
        grid: [{ //设置边距
            left: 55,bottom: 53,top: 20,right: 10
        }],yAxis: { //Y轴配置
            show: true,axisLine: {
                show: false,lineStyle: { //隐藏Y轴
                    opacity: 0
                }
            },axisTick: { //隐藏刻度
                show: false,},splitLine: { //隐藏刻度
                show: false,axisLabel: { //Y轴文字
                color: '#fff',fontSize: 12
            },xAxis: { //X轴配置
            data: category,//X轴数据
            show: true,axisLabel: { //X轴文字样式
                color: '#a9aabc',fontSize: 12,interval: 0,padding: [10,0]
            },axisLine: {
                show: false
            },axisTick: {
                show: false,}
        },series: [{
            name: '',type: 'pictorialBar',//设置类型为象形柱状图
            symbol: 'roundRect',//图形类型,带圆角的矩形
            barWidth: '11%',//柱图宽度
            barMaxWidth: '20%',//最大宽度
            symbolMargin: '3',//图形垂直间隔
            animationDelay: (dataIndex,params) => { //每个图形动画持续时间
                return params.index * 50;
            },itemStyle: {
                normal: {
                    color: params => { //图形渐变颜色方法,四个数字分别代表,右,下,左,上,offset表示0%到100%
                        return new echarts.graphic.LinearGradient(
                            1,1,[{
                                    offset: 0,color: colorList.first[params.dataIndex]
                                },{
                                    offset: 1,color: colorList.second[params.dataIndex]
                                }
                            ])
                    }
                }
            },z: 1,symbolRepeat: true,//图形是否重复
            symbolSize: [25,6],//图形元素的尺寸
            data: lineData,//Y轴数据
            animationEasing: 'elasticOut' //动画效果
        }]
    }
    timeTick()
}
let disposeChart = () => { //销毁chart
    _myChart.dispose()
    _myChart = null
}
let setOption = () => { //重置数据
    _option.xAxis.data = category.slice(chartConfig.first,chartConfig.second)
    _option.series[0].data = lineData.slice(chartConfig.first,chartConfig.second)
    _myChart.setOption(_option,true)
}
let timeTick = () => { //定时器,最好用延时加递归,如果用setInterval,容易造成堵塞
    if (timeTickId) {
        clearTimeout(timeTickId)
        timeTickId = 0
    }
    autoChangeData()
    timeTickId = setTimeout(timeTick,1000 * timer || 5000)
}
let autoChangeData = () => { //偏移数组,切换数据
    if (!chartConfig.max) {
        return
    }
    if (chartConfig.second >= chartConfig.max) {
        chartConfig.second = chartConfig.second - chartConfig.first
        chartConfig.first = 0
    } else {
        chartConfig.first++
        chartConfig.second++
    }
    setOption()
}
let filterData = (data,category = [],lineData = []) => { //过滤后端数据,分别变成X轴数组和Y轴数组
    data.forEach(item => {
        item.typeName = item.typeName.length > 2 ? item.typeName.substring(0,2) : item.typeName
        category.push(item.typeName || '')
        lineData.push(item.bnum || 0)
    })
    return {
        category,lineData
    }
}
原文地址:https://blog.csdn.net/time_____
版权声明:本文内容由互联网用户自发贡献,该文观点与技术仅代表作者本人。本站仅提供信息存储空间服务,不拥有所有权,不承担相关法律责任。如发现本站有涉嫌侵权/违法违规的内容, 请发送邮件至 dio@foxmail.com 举报,一经查实,本站将立刻删除。